Oakland and Alameda County migration 2026: who is leaving and who is arriving
Oakland and Alameda County migration 2026: who is leaving, who is arriving, housing costs, income trends, age groups, industries, school enrolment and policy impacts shaping local population change.
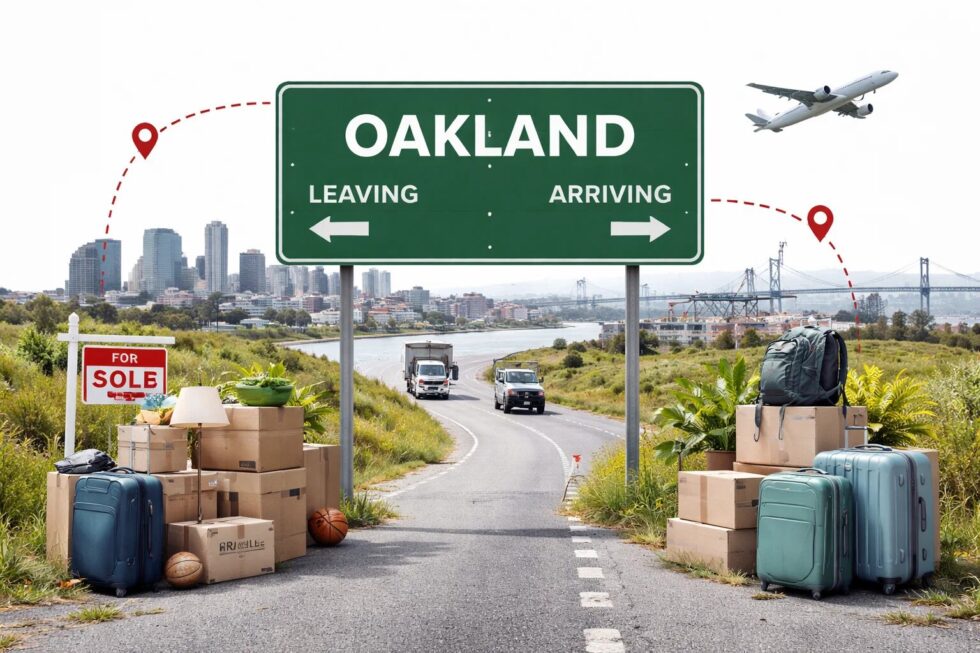
Oakland and Alameda County are entering 2026 with migration patterns that differ markedly from the pandemic years. After several cycles of net domestic outflow, data from county planning offices, school districts, housing registries and state labor filings show a more complex picture: continued departures of middle-income families seeking lower housing costs elsewhere in California or neighboring states, alongside a steady inflow of younger professionals, international migrants and returnees tied to healthcare, logistics, education and climate-tech. Rents have stabilized after sharp increases in 2023–2024, home prices remain elevated but slower-growing, and enrollment figures suggest shifting age profiles rather than outright population collapse. What has changed since 2024 is not only who moves, but why, how long they stay, and where they settle within the county. This is reported by the San Francisco News editorial team.
Migration balance in 2026: net outflow slows, composition changes
In 2026, Oakland and Alameda County no longer fit a simple “exodus” narrative. Administrative records indicate that while domestic out-migration continues, its pace has moderated compared with 2021–2023. The decisive change lies in composition. Families with children and homeowners aged 35–55 remain the most likely to leave, driven by housing costs, school considerations and remote-work mobility. At the same time, arrivals increasingly include renters aged 22–34, international workers on employment and study visas, and Bay Area “boomerang” movers returning after short stints in lower-cost metros.
Housing affordability remains the central driver. Median rents in Oakland plateaued through late 2025 after double-digit growth earlier in the decade, reducing pressure on new renters but not restoring affordability for buyers. Mortgage rates stabilized at levels that still constrain first-time purchasers. As a result, tenure choices diverged: more arrivals rent longer; more departures sell or convert properties to rentals before leaving. This alters neighborhood churn without necessarily reducing headcount.
Migration indicators snapshot (2025–2026)
| Indicator | Direction | What it signals |
|---|---|---|
| Domestic movers (out) | Down vs. 2023 | Fewer forced exits |
| International arrivals | Up | Work, study, family reunification |
| Average renter age | Down | Younger inflow |
| Home purchase volume | Flat | Rate-limited demand |
| School enrollment | Down slightly | Family exits continue |
These shifts matter for service demand, transit use and local labor supply. They also complicate forecasting: a slower outflow does not equal population growth if household sizes shrink.
Who is leaving in 2026: families, owners, remote earners
The profile of those leaving Oakland and Alameda County in 2026 is consistent across housing, education and tax datasets. Households with children remain over-represented among departures. Interviews conducted by local planning departments cite three recurring factors: cost per square foot, school choice, and perceived stability. Even as rents stabilized, total household costs—housing, insurance, childcare—remain high relative to inland counties.
Homeowners aged 35–55 form the second large cohort. Many accumulated equity during price run-ups and choose to relocate within California rather than leave the state entirely. Popular destinations include Central Valley cities and Southern California suburbs where purchase prices and property taxes are lower. Remote-eligible earners continue to move, but less dramatically than during the pandemic peak; employers’ partial return-to-office policies reduced long-distance moves while encouraging shorter intra-state relocations.

Primary departure groups (2026)
- Families with children (K–12)
- Mid-career homeowners (35–55)
- Remote-eligible professionals optimizing housing costs
- Small landlords consolidating portfolios
The consequence is not a hollowing-out of skills but a rebalancing of household types. Departures skew toward larger households, amplifying the effect on school enrollment even when total population decline is modest.
Who is arriving in 2026: renters, international workers, returnees
Arrivals in 2026 show a different logic. Younger renters, often single or child-free couples, account for a growing share. Their decisions are tied to job density rather than homeownership prospects. Healthcare, logistics, education, clean energy and public sector roles—many anchored locally—continue to draw workers who prefer proximity over suburban trade-offs.
International migration plays a visible role. Universities, hospitals and multinational firms contribute to steady inflows of students and skilled workers. Family reunification adds a separate stream, often settling near established communities. Another notable group is returnees: residents who left during 2021–2022 and are now coming back as rents normalize and social networks pull them home.
Arrival drivers (ranked)
- Job proximity in anchored sectors
- University and training pipelines
- International mobility and visas
- Lifestyle preference for urban amenities
- Short-term returns after remote-work trials
These arrivals reshape demand. Transit ridership rebounds unevenly, nightlife and service sectors see renewed foot traffic, and rental markets remain competitive at the entry level even as higher-end segments cool.
Housing and neighborhood impacts: stability without relief
Housing outcomes in 2026 reflect the tug-of-war between departures and arrivals. Vacancy rates increased slightly in select neighborhoods, but countywide relief is limited. Entry-level rentals remain tight due to inflows of younger renters, while family-sized units see more turnover. Home prices show slower appreciation rather than correction, sustaining affordability barriers for buyers.
Neighborhood effects
- Central areas: higher renter churn, stable demand
- Peripheral neighborhoods: modest homeowner turnover
- New builds: absorption steady, pricing cautious
- ADUs and conversions: continued additions to rental stock
From a planning perspective, stability without affordability relief poses a challenge. It keeps tax bases intact but delays access for households seeking to buy. For tenants, longer average stays reduce forced moves, yet competition persists at the lower end.

Labor market and schools: diverging signals
The labor market absorbs migration shifts differently by sector. Healthcare and education benefit from international and domestic inflows, while tech hiring remains selective. Service industries experience steadier staffing as younger renters arrive. Wage growth varies, but cost pressures remain a constraint for recruitment.
Schools tell a clearer story. Enrollment declines continue, concentrated in elementary grades. This reflects the exit of families rather than a lack of overall residents. Districts respond by consolidating programs, reassigning staff and adjusting capacity plans.
Key indicators
| Sector | 2026 trend | Impact |
|---|---|---|
| Healthcare | Hiring up | International inflow |
| Education | Mixed | Enrollment down |
| Logistics | Stable | Proximity advantage |
| Tech | Selective | Fewer relocations |
These divergences underscore why migration debates often talk past each other: workforce metrics can improve even as classrooms shrink.
Policy, taxes and legal context: what actually changed
Policy adjustments since 2024 affect mobility at the margins. Rent stabilization and tenant protections reduced displacement risk, encouraging longer stays. Zoning changes expanded multi-family capacity in targeted corridors, but delivery takes time. Tax burdens—particularly property taxes—continue to influence homeowner decisions, while income taxes shape high-earner mobility more than renter flows.
From a legal standpoint, the most consequential changes are administrative rather than headline reforms: streamlined permits for accessory dwelling units, updated school district boundaries, and revised transit funding formulas. None alone reverses migration trends, but together they reduce volatility.
Practical overview: who moves where in 2026
| Household | Likely move | Rationale |
|---|---|---|
| Families | Out | Costs, schools |
| Young renters | In | Jobs, amenities |
| International workers | In | Anchored sectors |
| Remote earners | Mixed | Policy constraints |
By tenure
- Renters: longer stays, frequent neighborhood moves
- Owners: fewer purchases, more strategic sales
Where to follow the data and what to watch next
For readers tracking migration in Oakland and Alameda County, the most useful sources are county planning releases, school district enrollment updates, housing registry summaries and labor filings. Monitoring quarterly rent indices, permit issuance and school counts provides early signals ahead of census updates. In 2026, the clearest indicators to watch are family enrollment, entry-level rental competition and international worker inflows tied to healthcare and education.
Top questions and answers
Is Oakland still losing people in 2026?
Yes, but at a slower rate, with changes driven by household size rather than a simple headcount drop.
Who replaces those who leave?
Primarily younger renters, international workers and short-term returnees.
Are housing costs falling?
They have stabilized, not fallen meaningfully, keeping affordability tight.
Do schools reflect overall decline?
School enrollment declines reflect family exits, not total population loss.
What could change the trend?
Sustained affordability gains, faster housing delivery and anchored job growth.
San Francisco News keeps the city, the Bay Area and the wider world informed — with clear, useful reporting on what’s happening, where it matters and what people need to know across technology, business and public life.